

How to Save $150K/Year Self-Hosting LLMs

You’ve spent weeks building your vLLM setup. Tests pass. Monitoring dashboards show green. Your fallback strategy works. Everything runs perfectly on your laptop. Then someone asks the inevitable question: “Are we ready for production?”
That question reveals a significant gap. Running docker-compose up on your machine is one thing. Serving production traffic to users who expect reliability is entirely different. The distance between these two stages is larger than most engineers expect.
At 5 million requests per month, downtime has real consequences. That’s roughly 7 requests per second. When vLLM goes down, revenue drops. Users get frustrated. Your phone starts buzzing with alerts. You can’t experiment with production traffic without risking your reputation and your users’ trust.
This post bridges the gap. We’re taking everything from the previous parts of this series and building a production system that handles real user traffic reliably.
What We’ve Built So Far
The previous posts in this series established the foundation for a robust system. Part 1 identified problems with notebook code: no type safety, no tests, just pure chaos. Part 2 introduced BAML to add structure and type safety to LLM interactions. Part 3 covered comprehensive testing strategies to catch bugs before production. Part 4 walked through vLLM self-hosting, monitoring, dashboards, and fallback strategies to OpenAI.
These pieces work well independently, but they’re still isolated components. Now we need to connect them into a cohesive production system. This means automated deployments that don’t require manual SSH sessions. Proper deployment strategies that minimize risk. Rollback plans for when things inevitably go wrong. Runbooks so your team knows exactly what to do at 3AM. Operational patterns that prevent most of those 3 AM emergencies in the first place.
The Complete Architecture
Your production system needs several components working together seamlessly.
Start with a load balancer that distributes traffic across API instances. This load balancer handles SSL termination so your API services don’t worry about certificates. It kicks out unhealthy instances automatically so users never hit broken services. It implements rate limiting to prevent abuse and ensures no single user consumes all your resources. You can use AWS Application Load Balancer, nginx, or HAProxy depending on your infrastructure preferences and existing expertise.
Behind the load balancer sit multiple API service instances. Having multiple instances is critical for reliability. If one instance crashes because of a memory leak or unexpected bug, traffic continues flowing to the healthy instances. Each instance runs your BAML code from Part 2, handles HTTP requests from users, calls vLLM for inference, and falls back to OpenAI when needed. Running three to five instances provides good redundancy without excessive costs.
The API services connect to vLLM instances for model inference. These are GPU-backed containers running vLLM from Part 4. Each instance operates independently with its own GPU allocation. The load balancer distributes inference requests across them using algorithms like round-robin or least connections. This distribution prevents any single GPU from becoming a bottleneck while others sit idle.
When vLLM fails, requests automatically fall back to OpenAI. This safety net catches you when self-hosted infrastructure has problems. Part 4 established this fallback pattern using circuit breakers that detect failures and route traffic appropriately. The circuit breaker prevents cascading failures where every request times out waiting for a broken LLM instance.
Monitoring and logging sit beneath everything, collecting data about system health. Prometheus tracks metrics like request rates, error rates, latency percentiles, and GPU utilization. Grafana visualizes these metrics in dashboards that make system health obvious at a glance. Structured logs capture detailed information about what’s happening and why. This observability layer is absolutely essential for maintaining sanity in production. You can’t fix problems you can’t see.
Directory Organization
Organization matters more than you might expect when working on production systems. A well-structured project helps team members find what they need quickly. New engineers understand the system layout without extensive explanation. Here’s how to structure your production application.
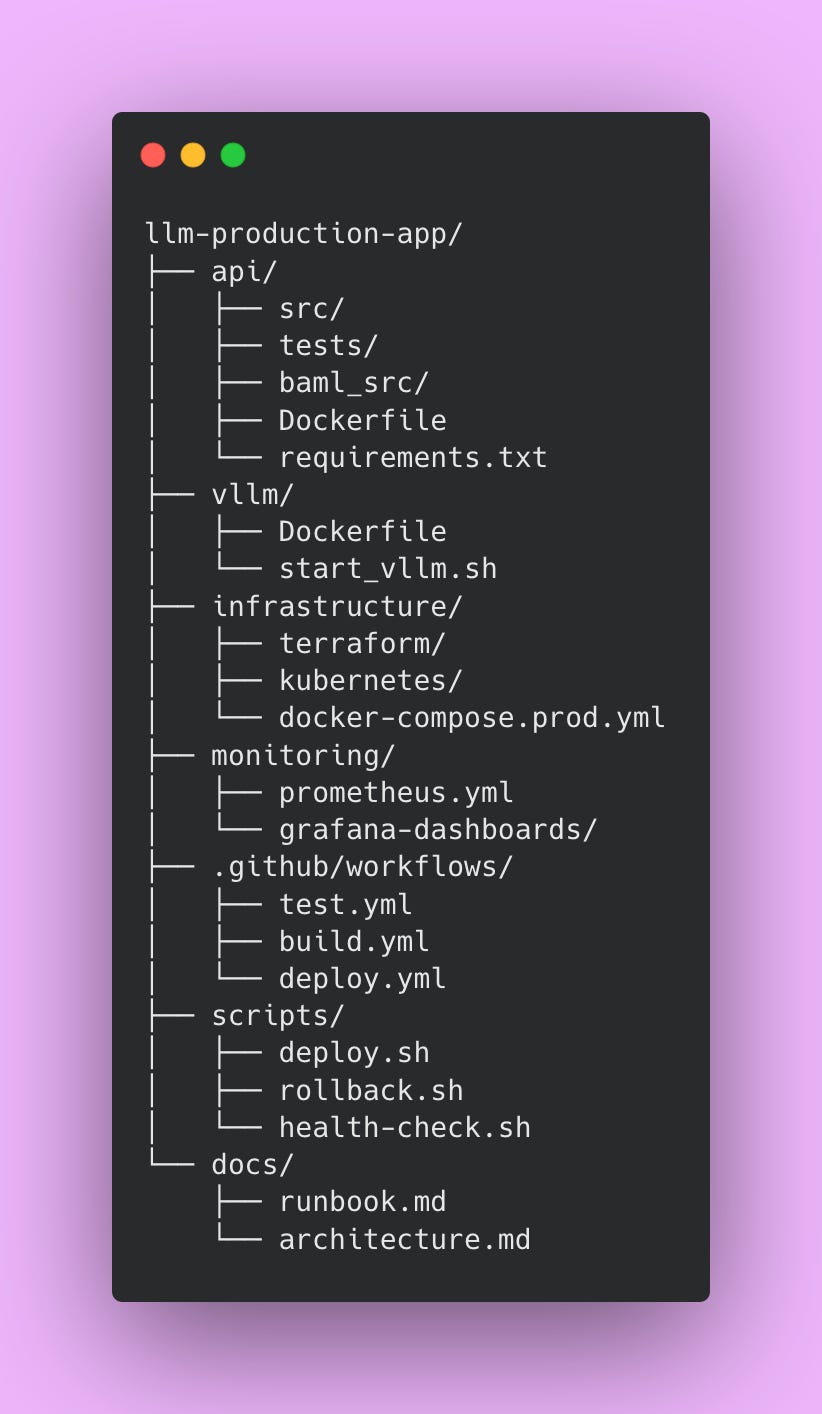
The api directory contains your main application code, tests from Part 3, and BAML definitions from Part 2. Everything related to the API service lives here. The vllm directory holds vLLM-specific Docker configuration and startup scripts. Keeping this separate from the API makes it easier to update vLLM independently.
The infrastructure directory stores deployment configurations. Terraform files define your cloud resources declaratively. Kubernetes manifests describe how to deploy your services. Docker Compose production configurations show how pieces fit together. Having all infrastructure-as-code in one place makes environments reproducible and prevents configuration drift.
The monitoring directory contains Prometheus scraping configurations and Grafana dashboard definitions. Storing dashboards as code means you can version control them and restore them if someone accidentally deletes a dashboard.
The .github/workflows directory holds CI/CD pipeline definitions. These YAML files automate testing, building, and deploying your application. The scripts directory contains bash scripts for common operations like deploying, rolling back, and health checking. These scripts get used by CI/CD pipelines and can also be run manually when needed.
The docs directory stores operational documentation. The runbook explains how to handle common issues. The architecture document describes how components interact. Future team members will thank you for thorough documentation.
This structure separates concerns clearly while keeping related files together. Engineers can navigate the codebase efficiently, which becomes increasingly important as your team grows.
Implementing CI/CD
Manual deployments create problems that compound over time. Before implementing CI/CD, deployments required SSH access to production servers. You’d manually stop services, pull new Docker images, restart everything, and hope it worked correctly. Each engineer performed these steps slightly differently. One engineer might restart services in a different order than another. Someone might skip health checks in a rush. There’s no automated record of what changed or when it changed.
This approach fails at scale. With five deployments per week, manual processes consume significant engineering time. Each deployment takes 30-45 minutes including coordination, execution, and verification. That’s 2.5-3.75 hours per week just on deployment mechanics. Documentation for manual processes goes stale quickly because maintaining deployment docs requires discipline most teams lack. New team members take weeks to learn the deployment process through shadowing and trial by error. When something breaks during deployment, debugging is difficult because you don’t know exactly what changed or in what order.
CI/CD solves these problems through automation and consistency. Every code change triggers tests automatically. Tests must pass before any deployment proceeds. This catches bugs early before they reach production. Deployments happen exactly the same way every time, eliminating inconsistencies from human variation. You get a complete audit trail showing what changed, when it changed, and who approved it. Most importantly, bugs get caught in CI rather than production. The testing happens before code merges, preventing broken code from ever reaching users.
The investment in CI/CD pays dividends quickly. After spending a few days setting up pipelines, deployments become routine operations instead of anxiety-inducing events. You can safely deploy ten times per day if needed. New engineers deploy confidently during their first week because the process is automated and documented. When problems occur, the audit trail helps you identify exactly what changed. The consistency means fewer deployment-related incidents because you’re not introducing human error.
The Test Pipeline
This pipeline runs on every pull request and prevents broken code from reaching the main branch. Every PR must pass these tests before merging.
Create this file at .github/workflows/test.yml:
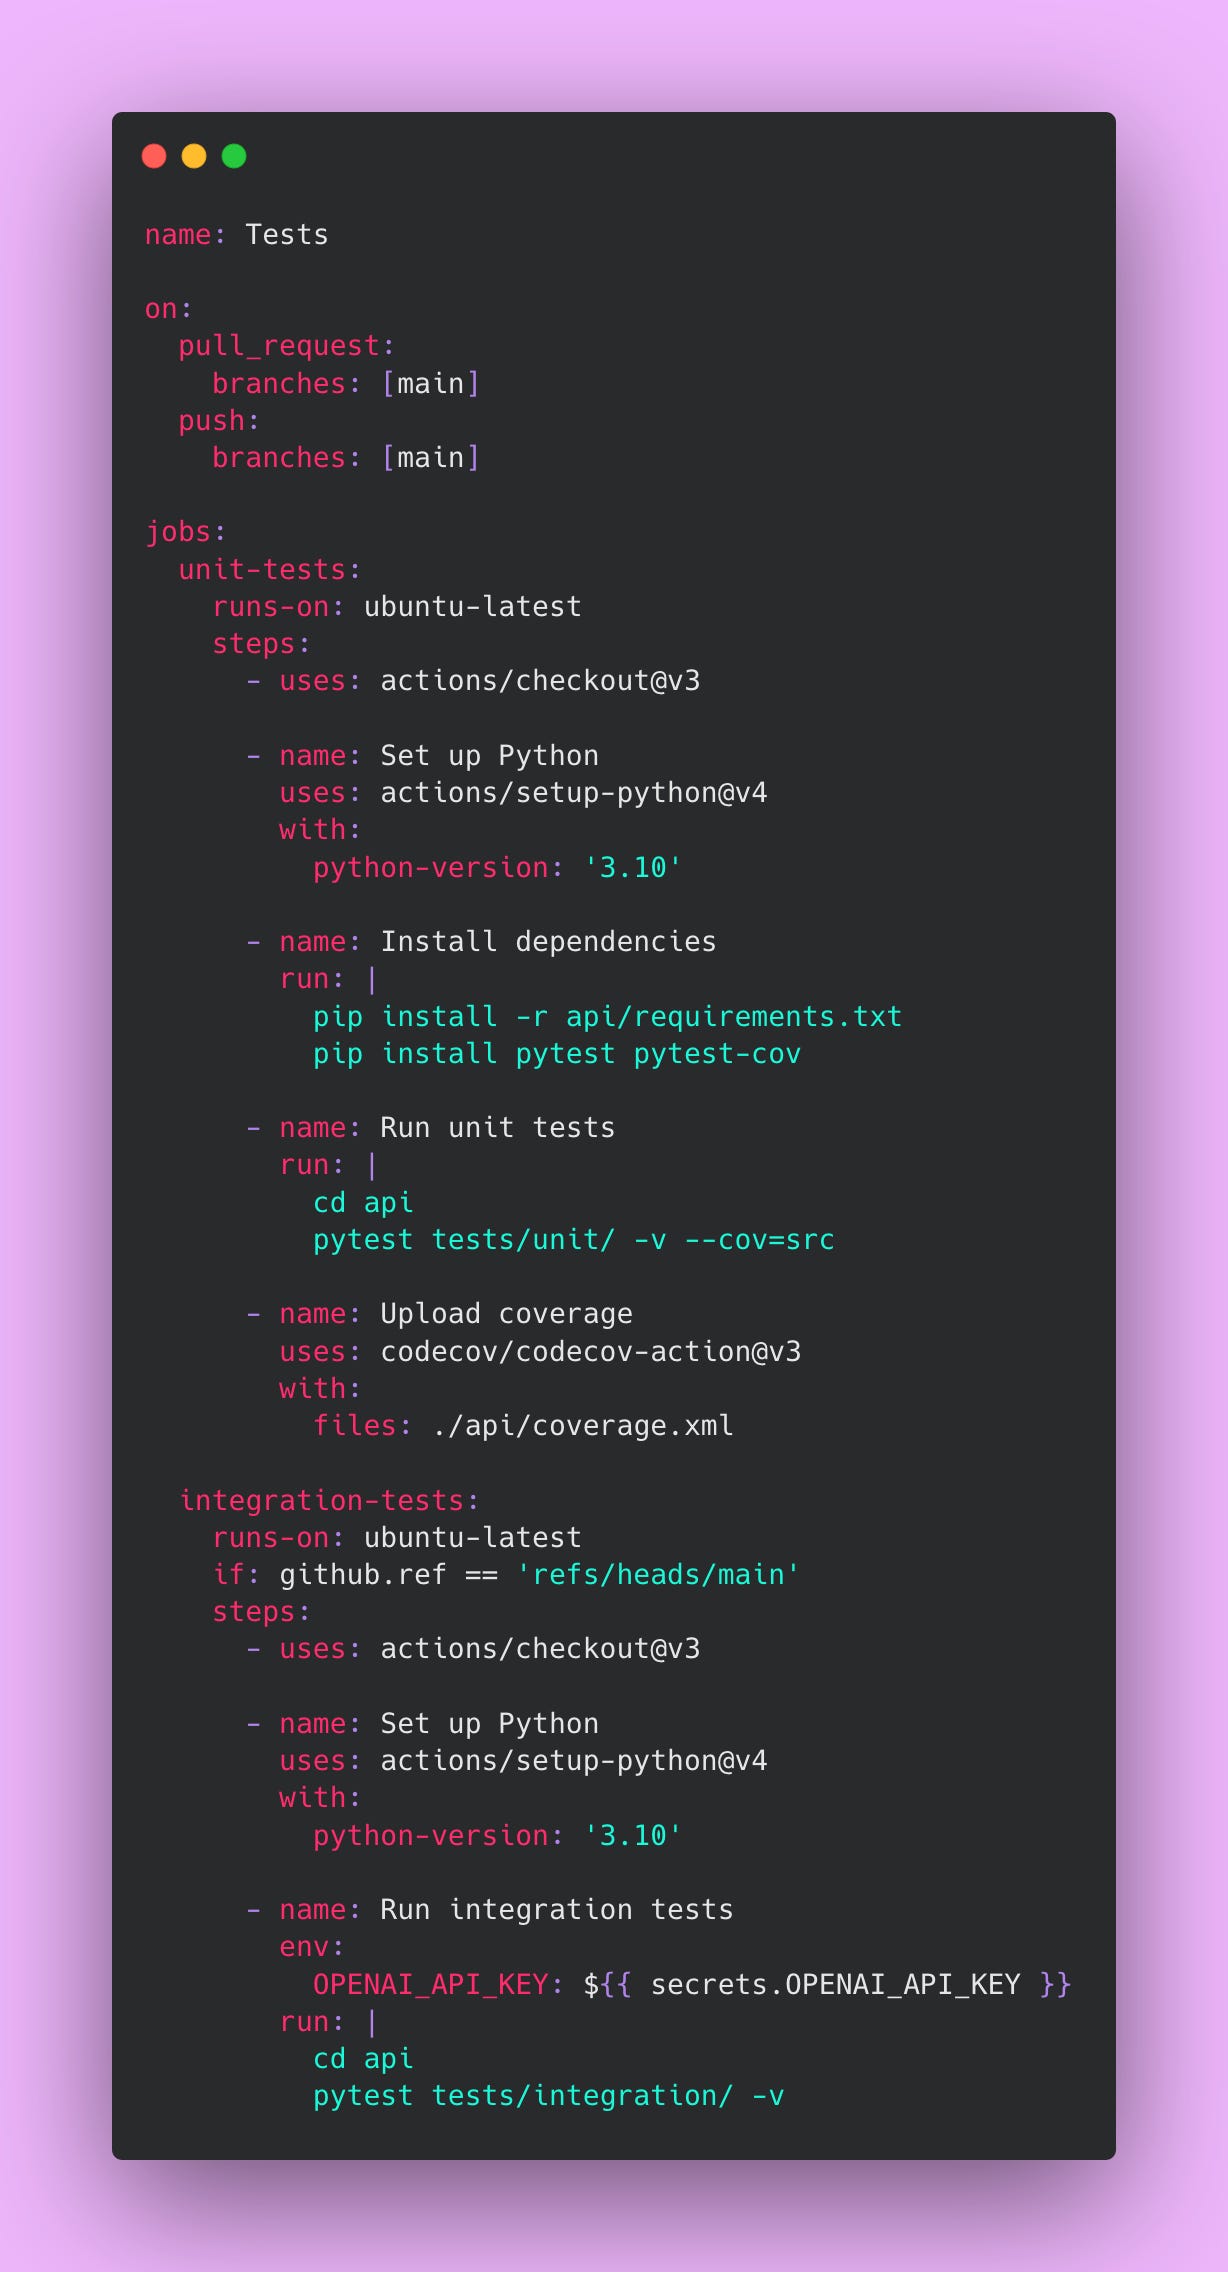
Unit tests run on every pull request because they’re fast (usually completing in under 2 minutes) and free. They validate your code’s logic without making external API calls. These tests catch type errors, logic bugs, and regression issues early in the development cycle. Catching bugs during code review is much cheaper than catching them in production.
Integration tests only run on the main branch because they’re slower and cost money through OpenAI API calls. Running them on every PR would waste money testing code that might not even merge. Running them on main provides a safety net after merge, confirming the integrated system still works correctly. If integration tests fail on main, you know immediately and can investigate before deployment.
⚠️ Never commit API keys directly to your repository. Use GitHub Secrets to store sensitive credentials. Navigate to Settings, then Secrets and Variables, then Actions to add secrets. GitHub encrypts these secrets and only makes them available to workflows. This prevents credentials from leaking into version control history, which would require key rotation and potential security incident response.
The coverage report uploads to Codecov, giving you visibility into which code paths your tests exercise. Aim for 80% coverage as a minimum. Lower coverage means untested code paths that might contain bugs. Higher coverage gives you confidence that your tests actually validate the code.
The Build Pipeline
This pipeline creates Docker images and pushes them to a container registry. Every successful merge to main triggers a build.
Create this file at .github/workflows/build.yml:
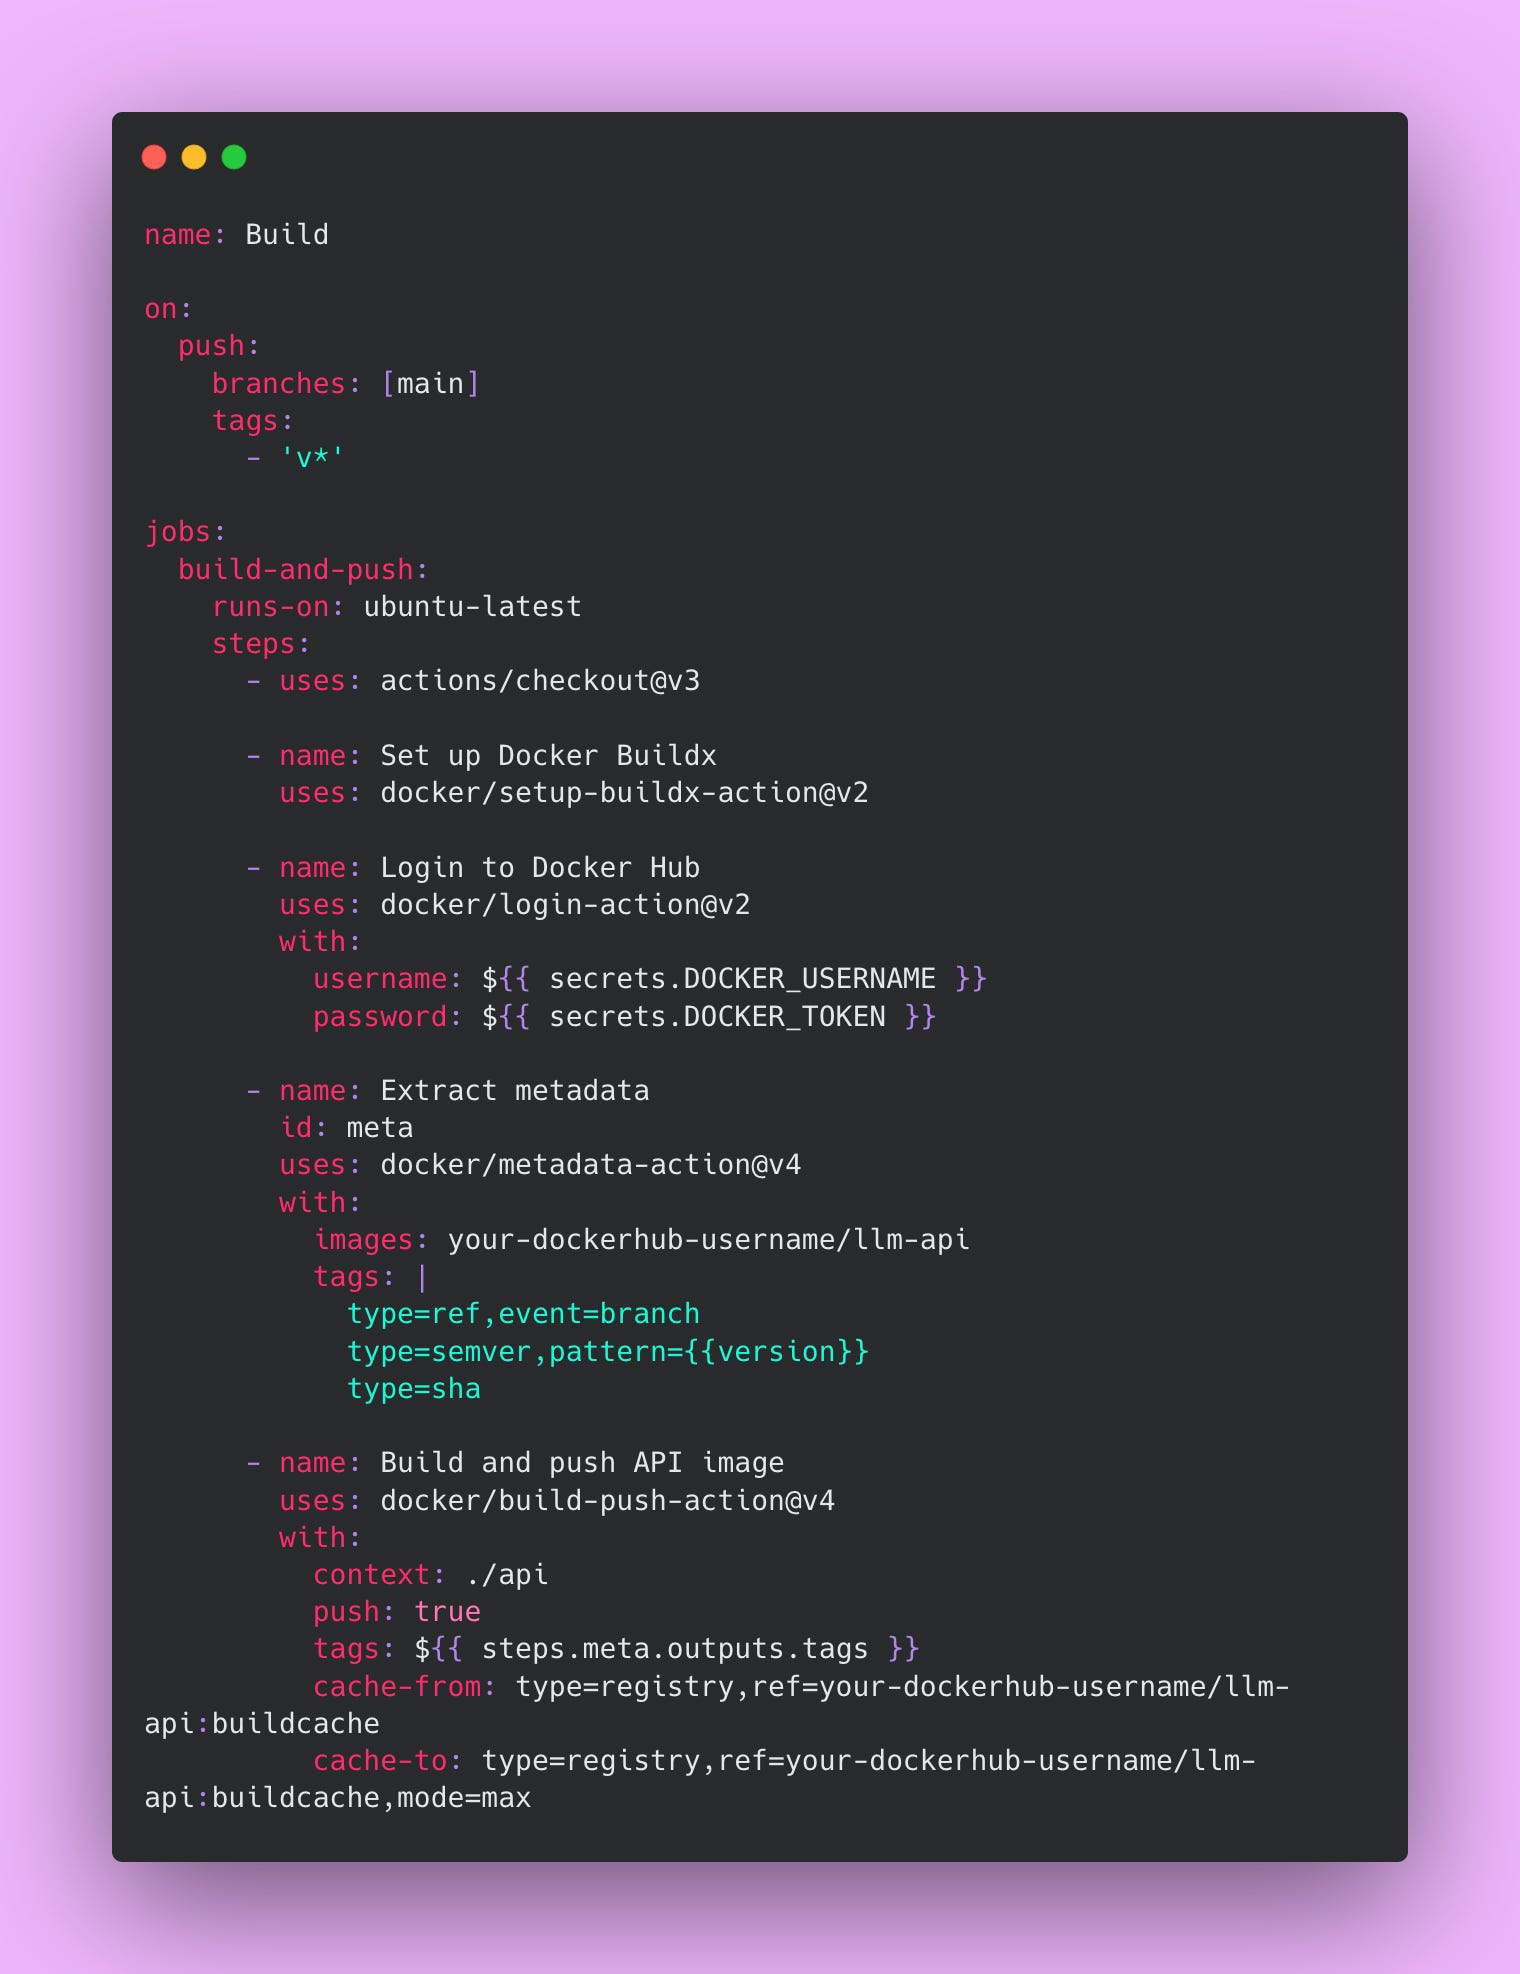
Image tagging follows a clear pattern that enables precise version tracking. The main branch gets the latest tag, which always points to the most recent build. Each commit receives a SHA tag like sha-abc123, allowing you to deploy or rollback to any specific commit. Git tags like v1.2.3 get semantic version tags following semver conventions. This tagging strategy enables easy rollbacks to specific versions when you need to quickly revert a problematic change.
The cache configuration dramatically improves build times by reusing layers from previous builds. The first build might take 10 minutes while Docker downloads base images, installs dependencies, and builds your application. Subsequent builds with caching take around 2 minutes because most layers are reused. The cache-from directive tells Docker where to find cached layers. The cache-to directive tells Docker where to store new cached layers. The mode=max option caches as many layers as possible for maximum speed.
Without caching, your CI/CD pipeline would waste significant time on every build. With caching, builds complete quickly enough that engineers don’t context switch while waiting. This keeps development velocity high.
The Deploy Pipeline
This pipeline automatically deploys built images to production after successful builds. It waits for the build to succeed, deploys to your infrastructure, verifies the deployment succeeded, runs smoke tests, and notifies your team.
Create this file at .github/workflows/deploy.yml:
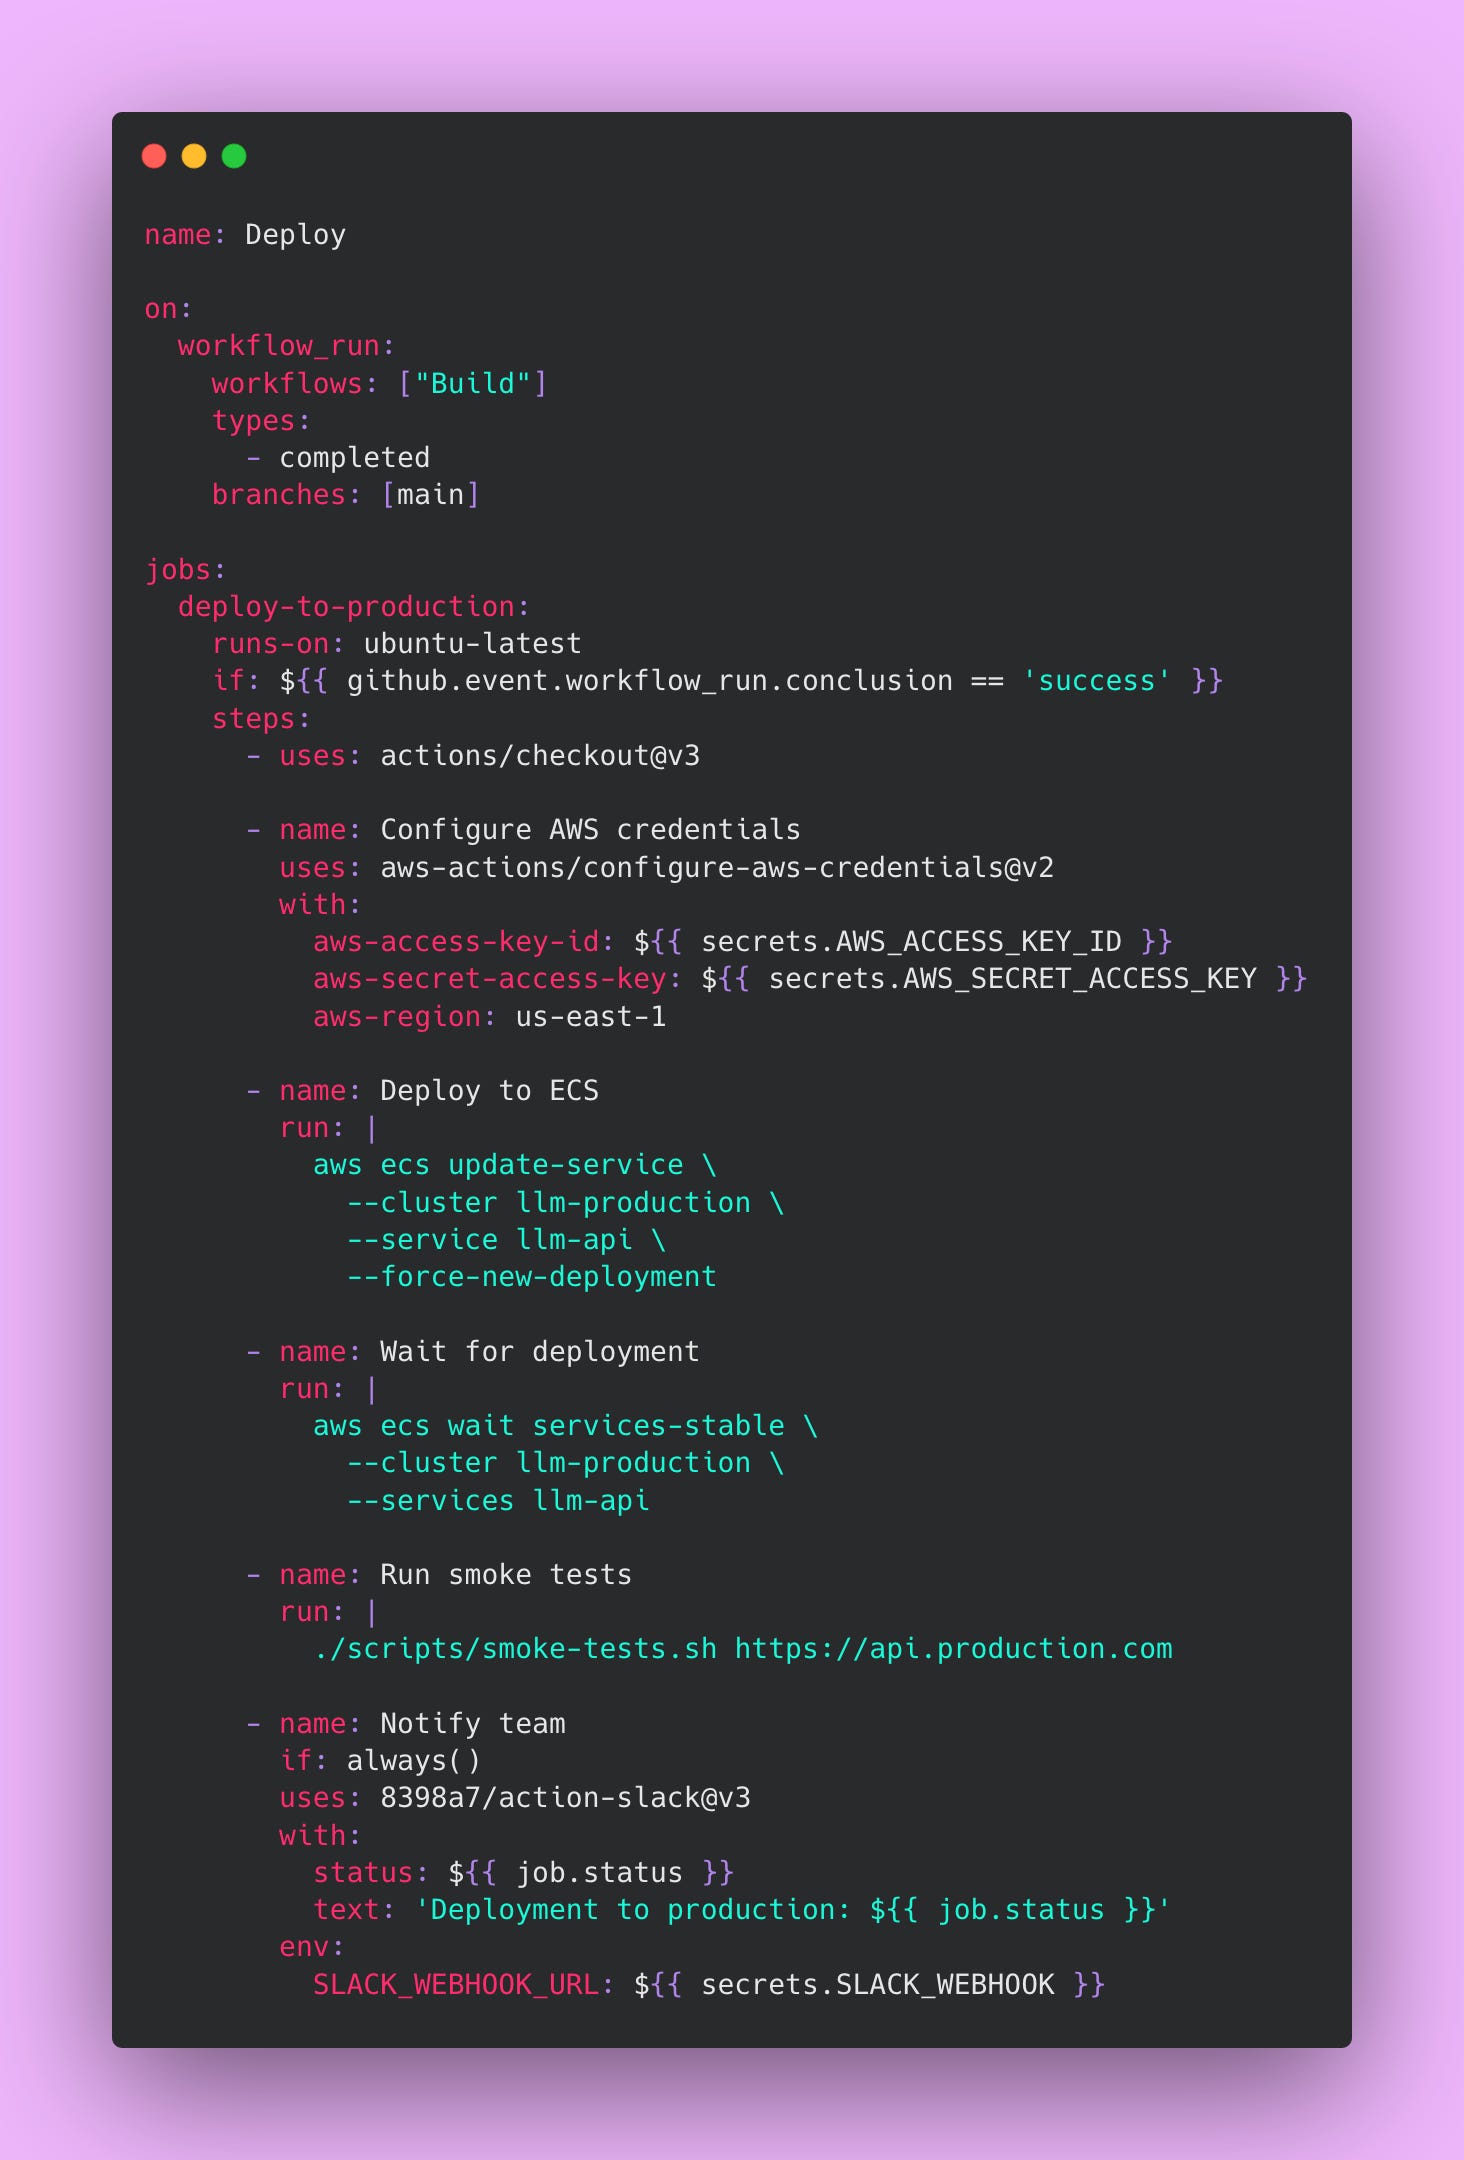
The workflow_run trigger waits for the build to complete successfully before starting deployment. The if condition checks that the build actually succeeded before deploying. This prevents deploying broken images to production.
The AWS ECS deployment forces a new deployment of service, which pulls the latest image and performs a rolling update. The wait services-stable command blocks until ECS confirms the new tasks are healthy and receiving traffic. This prevents the pipeline from proceeding if the deployment fails.
Smoke tests verify basic functionality after deployment. These tests should be fast and check critical paths like authentication, database connectivity, and basic API responses. Smoke tests catch obvious problems immediately after deployment while you still have context about what changed.
The notification step uses if: always() to send Slack messages regardless of success or failure. Success notifications confirm deployments completed successfully. Failure notifications alert the team immediately when problems occur. Having this visibility prevents situations where deployments fail silently and nobody notices until users complain.
Pre-commit Hooks
Finding problems on your local machine saves time compared to waiting for CI pipelines to run. Pre-commit hooks run formatters, linters, and quick checks locally before you even create a commit.
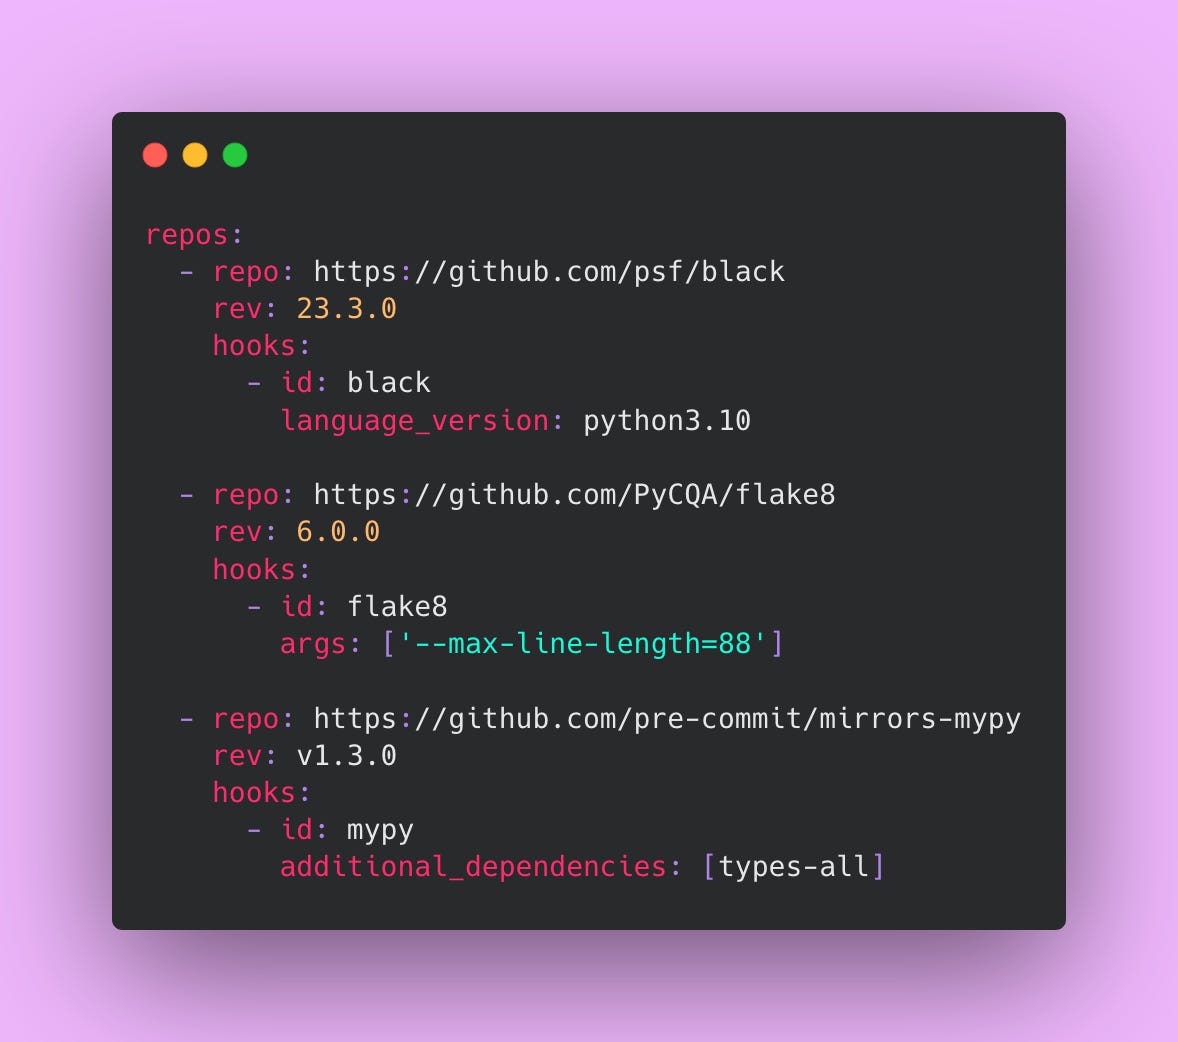
Create this file at .pre-commit-config.yaml:
Install pre-commit with pip install pre-commit then run pre-commit install in your repository. Now every commit triggers these checks automatically before the commit completes. If checks fail, the commit gets blocked until you fix the issues. This catches formatting inconsistencies, linting violations, and type errors immediately while the code is fresh in your mind.
Black formats your Python code consistently. This eliminates arguments about code style in pull requests. Everyone’s code looks the same regardless of personal preferences. Flake8 checks for common Python programming errors and enforces PEP 8 style guidelines. It catches issues like unused imports, undefined variables, and overly complex functions. Mypy performs static type checking, catching type-related bugs before runtime. These tools work together to maintain code quality without you being in the loop.
Deployment Strategies
Stopping all services, deploying the new version, and bringing everything back up at once is not the best idea. Production systems need sophisticated deployment strategies that minimize risk and enable quick rollbacks. These strategies determine how new versions roll out to users.
Blue-Green Deployment
Blue-green deployment maintains two complete production environments running at the same time.
The blue environment runs your current version and serves all production traffic. The green environment sits idle or runs your new version with no traffic. When you deploy, you update green with the new version while blue continues handling users with no interruption. You run your full test suite against green, verifying everything works correctly. You can even have a small number of internal users test green manually. The load balancer still points at blue during all of this testing so production users never see the new version until you’re ready.
Once you’ve confirmed green is healthy and behaving correctly, you update the load balancer configuration to route traffic to green instead of blue. This switch happens in seconds at the load balancer level. Users never experience downtime because one environment is always serving traffic. The cutover is nearly instantaneous from a user perspective.
If anything goes wrong after the switch (maybe you found a bug that tests didn’t catch), you point the load balancer back to blue. The rollback takes seconds because blue is still running with the old version You haven’t destroyed anything.
After running green in production successfully for a few hours or days, you can update blue with the next version and repeat the process. This alternating pattern continues: deploy to the idle environment, test it thoroughly, switch traffic, repeat. Each environment alternates between serving production and waiting as the deployment target.
Here’s an example script implementing blue-green deployment 👇🏾
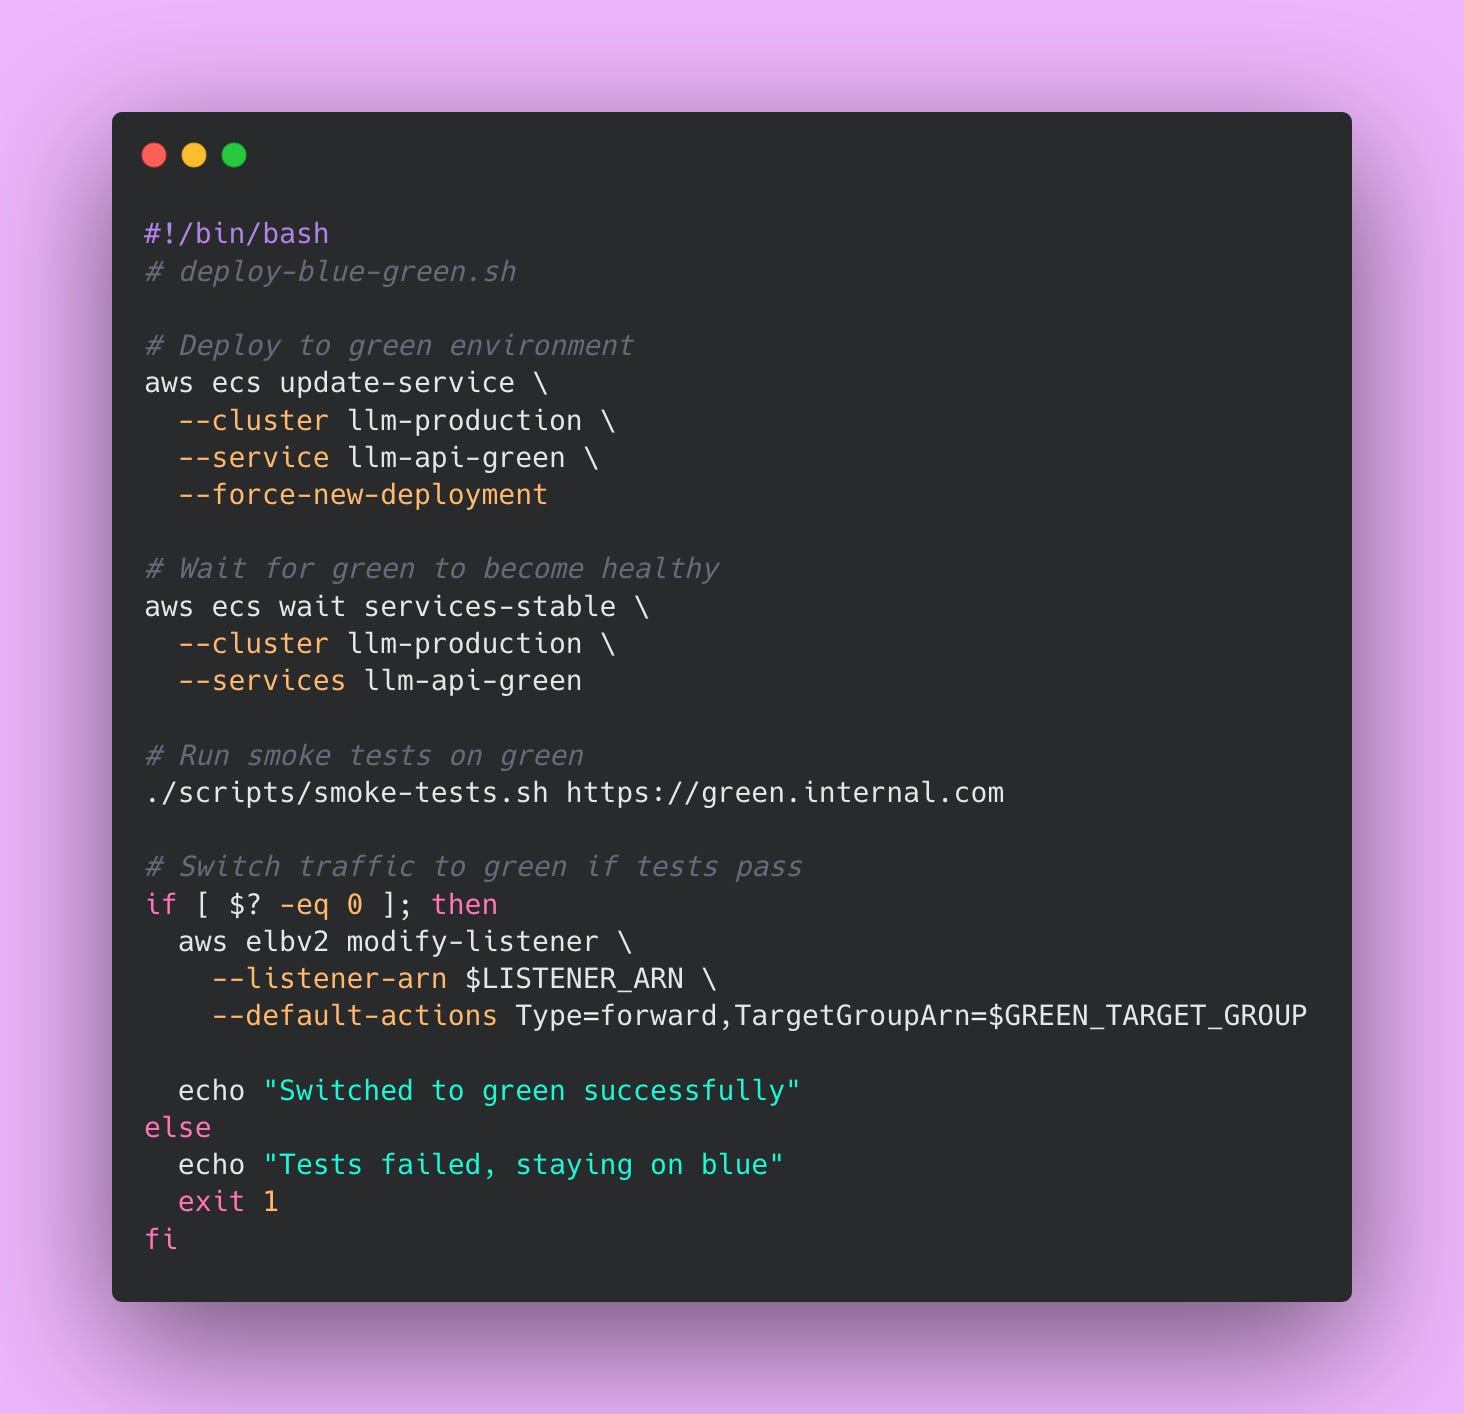
Blue-green deployment provides several advantages.
You get zero downtime deployments because one environment always serves traffic. You can test the new version thoroughly before users see it, catching issues in a production-like environment. Rollback happens instantly by switching the load balancer back.
The strategy is conceptually simple and easy to understand! Making it beginner friendly to teams new to advanced deployment strategies.
However, the main disadvantage is cost. You’re running double the infrastructure during deployments and even between deployments if you keep both environments running. For a system using three API instances and three vLLM instances, blue-green means running twelve instances instead of six. That doubles your compute costs.
Database migrations become complex because both environments must handle the same schema during the transition period. You can’t make breaking schema changes without coordination between versions. You also can’t test at real production scale until after the switch, so some issues only surface when all users hit the new version.
Use blue-green deployment for critical services where downtime is completely unacceptable.
Financial systems processing payments, healthcare applications managing patient data, and other high stakes services benefit from this approach. The instant rollback capability makes it worth the expense when every minute of downtime has significant business impact.
Canary Deployment
Canary deployment gradually shifts traffic to the new version by starting with a small percentage of users and increasing over time. Think of it like testing the water before jumping in. You start with 5% of users seeing the new version. If their experience looks good based on metrics, you increase to 25%, then 50%, then 100%. If anything looks wrong at any stage, you immediately route all traffic back to the old version.
The name comes from a coal mining practice back in the 20th century. Miners brought canary birds into mines because canaries are highly sensitive to toxic gases like carbon monoxide. If the canary becomes sick or dies, miners knew to evacuate immediately (thank goodness we have sensors now).

In deployment terminology, that small percentage of users acts as the canary. You monitor their experience closely to detect problems before affecting everyone else.
Here’s how the deployment process works. You deploy the new version alongside the old version. Initially, 95% of users continue hitting the old version while only 5% hit the new version. You monitor error rates, latency percentiles, and business metrics for both versions. If the canary group shows similar or better metrics than the control group, you increase the percentage. If the canary group shows worse metrics (higher error rates, slower response times, fewer successful transactions), you abort the rollout and route everyone back to the old version.
This gradual rollout continues in stages. At each stage, you wait a predetermined time (perhaps 10-15 minutes) while monitoring metrics. The waiting period lets issues surface before you expose more users. After confirming metrics look healthy, you proceed to the next stage. The final stage routes 100% of traffic to the new version and removes the old version.
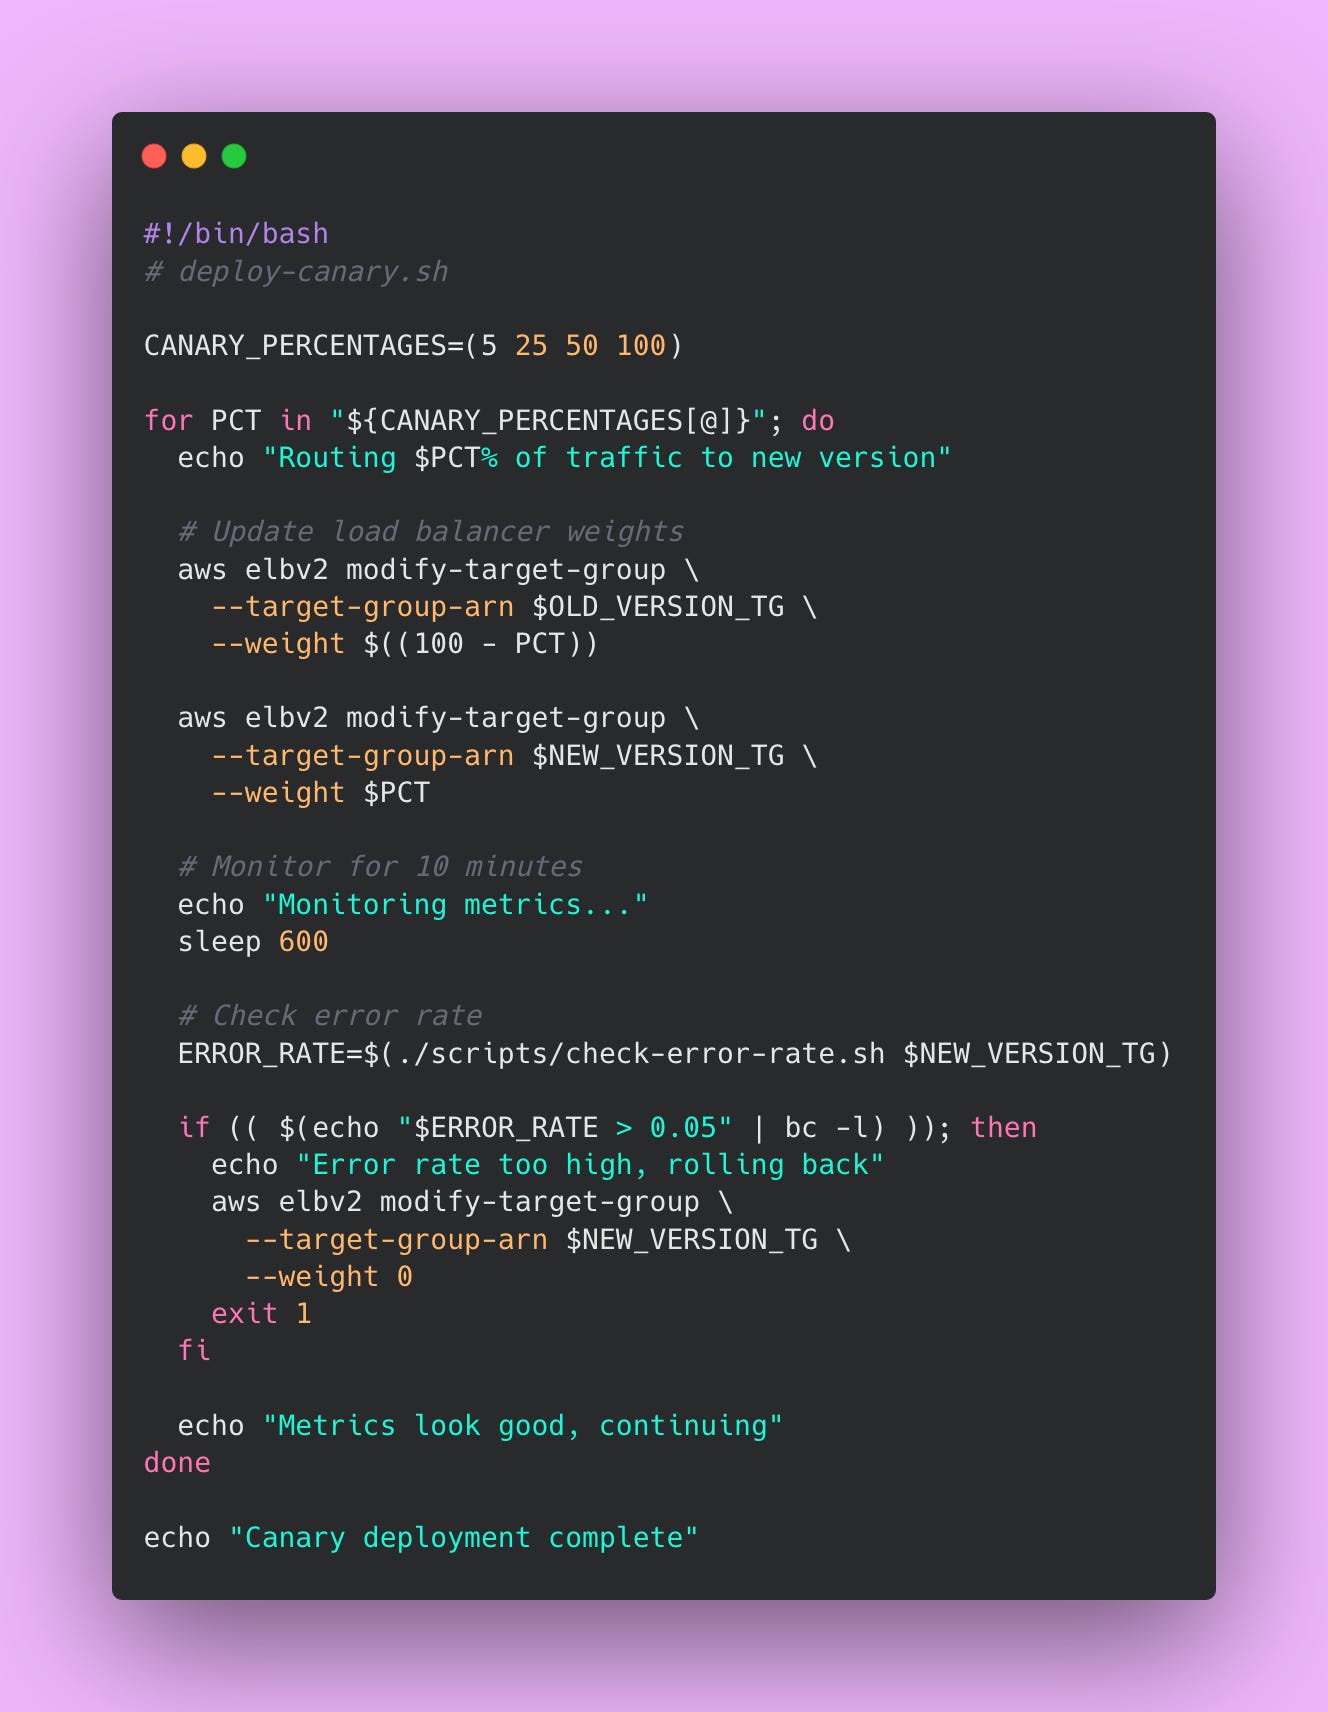
Here’s an example bash script that implements a canary deployment 👇🏾
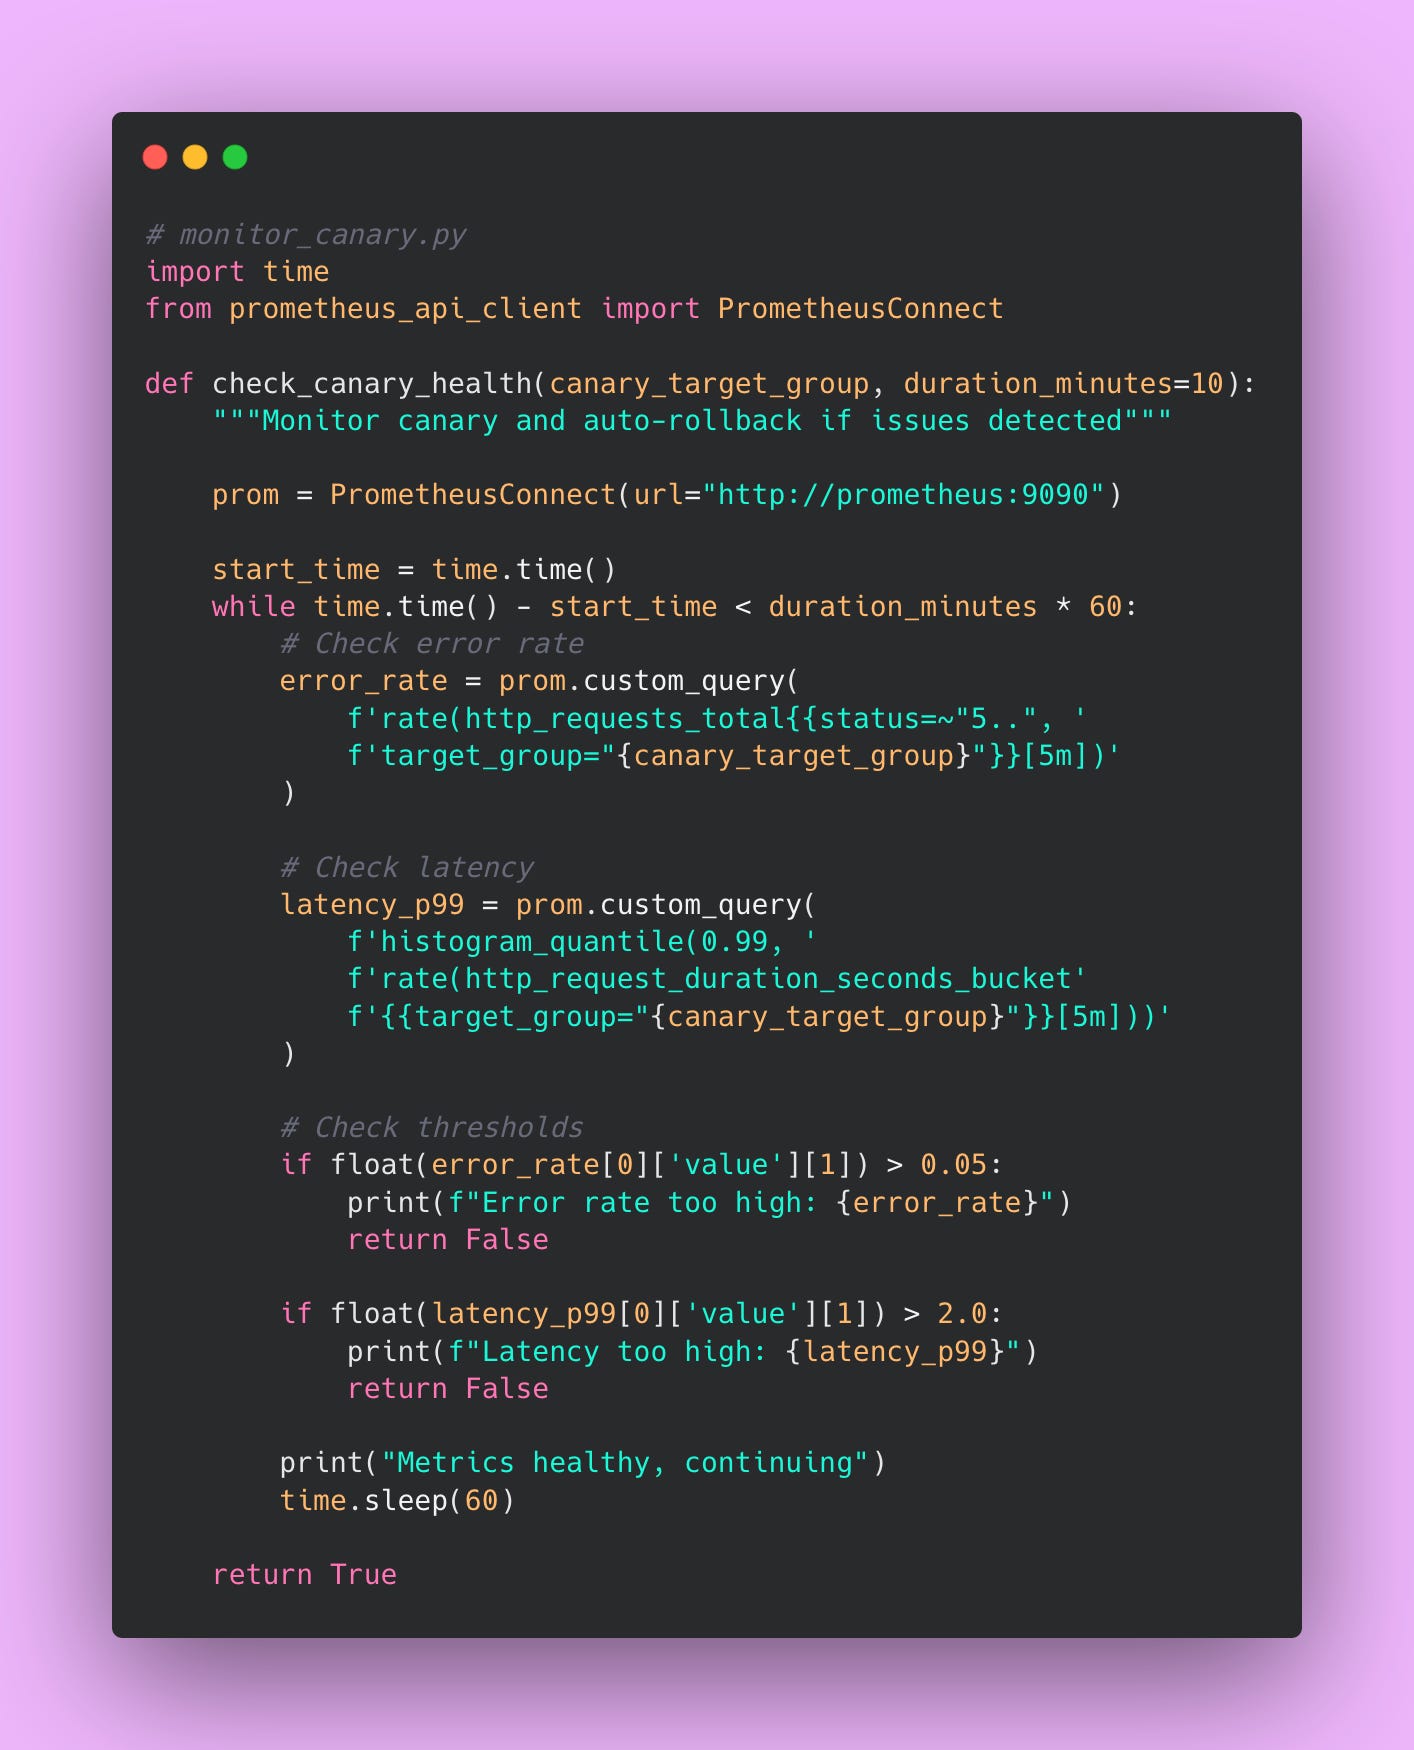
You can automate canary monitoring with Python.
Canary deployment provides several benefits. It carries lower risk than immediate full rollout because only a small percentage of users see the new version initially. It tests at real production scale with real user behavior patterns, catching issues that staging environments miss. Problems surface early when only 5-10% of users are affected rather than impacting everyone. You don’t need double infrastructure like blue-green deployment, keeping costs manageable.
The approach has some disadvantages. The complexity is higher than blue-green because you’re managing gradual rollout percentages and monitoring at each stage. Some users in the canary group might get a worse experience if the new version has issues, though this affects fewer people than a full rollout would. Good monitoring is absolutely essential because you can’t detect problems without it. And the deployment process takes longer than a simple cutover.
Overall the canary deployment provides a good balance between safety and practicality.
Rolling Deployment
Rolling deployment updates instances one at a time. With four API instances, you update the first instance while the other three continue serving traffic normally. Once the first instance is healthy and passing health checks, you update the second instance. You continue this pattern until all instances run the new version.
This strategy is the simplest to implement and understand. You start with instance one, update it with the new version, wait for health checks to pass, then move to instance two. The process continues sequentially through all instances. The load balancer automatically routes traffic away from instances during their update and back to them once they’re healthy.
You don’t need additional infrastructure. The deployment happens gradually, giving you opportunities to pause if problems appear. During the rollout, most of your capacity remains on the old version until near the end. If you notice issues during deployment, you can stop the rollout and investigate. Kubernetes actually implements rolling updates by default, making this approach accessible to teams already using Kubernetes.
The main issue with rolling deployments is version mixing. Both versions run simultaneously during deployment, which can cause problems. Imagine your new version expects a database field that doesn’t exist yet. Or maybe the new version changes an API response format that the old version can’t handle. These version compatibility issues require careful consideration.
Database migrations become tricky when different code versions expect different schemas. You need backward-compatible database changes.
The deployment is slower than blue-green cutover but faster than canary.
You can use rolling deployment as your default strategy when starting out. It’s simple to implement and understand. The gradual rollout provides some safety without requiring complex infrastructure or sophisticated monitoring. Many teams start here and slowly move up to canary deployment after establishing good monitoring.
Comparing and Choosing Strategies
Your requirements determine which strategy fits best. Let me walk through a decision framework.
If zero downtime is absolutely required, use blue-green or canary deployment. Rolling deployment might cause brief traffic disruptions during instance restarts, though this depends on your load balancer configuration.
If you need instant rollback capability, use blue-green deployment. The idle environment provides a perfect rollback target. Canary and rolling deployments require rolling back through your CI/CD pipeline, which takes longer.
If budget is limited and you want to avoid double infrastructure, use rolling or canary deployment. Blue-green requires maintaining two complete environments, doubling your infrastructure costs during and between deployments.
If you want to test at real scale before full rollout, use canary deployment. Blue-green tests in a production environment but not at production scale until after the switch. Rolling deployment provides no isolated testing.
If you want something simple to start with and plan to evolve later, use rolling deployment. It requires minimal infrastructure changes and no sophisticated monitoring initially.
Production Readiness Requirements
Before launching to production, your system must meet minimum requirements. These items are non-negotiable for production deployment. Skipping them can lead to major problems.

Your infrastructure needs at least two instances for redundancy. Single instances create a single point of failure. When that instance crashes due to an unexpected bug or infrastructure issue, your entire service goes down. Users get errors. Revenue stops. Metrics spike. Two instances mean one can fail while the other continues serving traffic. Three to five instances provide even better redundancy and handle traffic distribution more smoothly.
The load balancer must distribute traffic across these instances properly. Configure health check endpoints that the load balancer queries every few seconds. When an instance fails health checks, the load balancer stops routing traffic to it automatically. This prevents users from hitting broken instances. The load balancer should also handle SSL/TLS termination so your application doesn’t worry about certificate management.
Configure SSL/TLS certificates because serving unencrypted traffic in production is unacceptable in modern systems. Users expect HTTPS. Browsers show scary warnings for HTTP sites. Also, search engines penalize sites without HTTPS. Let’s Encrypt provides free certificates that auto-renew, eliminating cost as an excuse. AWS Certificate Manager also provides free certificates for AWS infrastructure. There’s no reason to skip this.
Configure DNS to give your service a domain name instead of requiring users to remember IP addresses. Configure A records pointing to your load balancer. Set up CNAME records for any subdomains. Test DNS resolution from multiple locations. DNS problems are frustrating to debug because of caching at multiple levels.
Security requires several configurations beyond just HTTPS. Remove all secrets from code completely! Even comments containing old API keys are dangerous. Use environment variables or a secrets management service like AWS Secrets Manager or HashiCorp Vault. These services encrypt secrets at rest and provide audit logs of secret access.
Configure rate limiting to prevent any single user from consuming all your resources. A misconfigured client making thousands of requests per second shouldn’t take down your entire service. Rate limiting protects you from both malicious attacks and accidental misuse.
Track GPU utilization to see whether you’re using GPU resources efficiently. If GPU utilization sits at 30%, you’re wasting money. If it constantly hits 100%, you need more GPUs. Request rates show traffic patterns and help you understand usage trends. Error rates indicate problems before users complain. A sudden spike in errors signals something broke. Track these metrics continuously and set up basic alerts 📈.
Create alerts for critical failure conditions. Alert when vLLM crashes completely so you know immediately. Alert when error rates exceed 5% so you can investigate before too many users are affected. Alert when latency exceeds acceptable thresholds so you can scale before users complain about slowness. Start with these basic alerts and add more as you learn what matters for your system.
Automate your deployment process with a CI/CD pipeline. Manual deployments don’t scale and introduce human error. The pipeline should run tests, build images, deploy to production, and verify success automatically. Document each step even though it’s automated. Documentation helps when the pipeline breaks or when you need to run steps manually during debugging.
Document the rollback procedure in detail and actually test it before you need it in an emergency. Rolling back under pressure is stressful. Having clear documentation and practiced procedures reduces that stress. Test rollbacks in a staging environment regularly to verify they work and to keep the team familiar with the process.
Implement post-deployment smoke tests that verify basic functionality after each deployment. These tests should be fast and check critical functionality. Can users authenticate? Can the service connect to the database? Do the main API endpoints respond correctly? Smoke tests catch obvious deployment problems immediately while you still have context about what changed.
Within the first month after launch, add more sophistication to your system. Configure auto-scaling so your infrastructure grows automatically with demand. This prevents manual scaling operations at 3 PM when traffic suddenly spikes. Auto-scaling based on CPU utilization, request rates, or custom metrics keeps your service responsive without constant manual intervention.
Set up proper network security with firewalls and security groups. Restrict access to internal services. Only expose what needs to be public. Close unnecessary ports. Use private subnets for database and internal services. These security layers provide defense in depth against attacks.
Track latency at different percentiles to understand user experience. The median (p50) shows typical performance. The 95th percentile (p95) shows what slower users experience. The 99th percentile (p99) shows the worst-case experience. A service with good p50 latency but terrible p99 latency frustrates some users even if most users are happy ☝🏾.
Monitor costs so you don’t get surprised by your cloud bill at month end. Set up billing alerts that notify you when spending exceeds expected amounts. Tag resources appropriately so you can attribute costs to specific services or teams. Review the bill monthly to identify optimization opportunities.
Create dashboards for all key metrics so anyone can see system health at a glance. The dashboard should show request rates, error rates, latency percentiles, GPU utilization, and fallback rates. Grafana dashboards work well for this. Share dashboard links with your team so everyone knows where to look when investigating issues.
Add circuit breakers for external dependencies like OpenAI so cascading failures don’t take down your entire system. When OpenAI is slow or returning errors, the circuit breaker opens and stops sending requests. This prevents your service from waiting indefinitely for responses that will never come.
Verify the OpenAI fallback actually works under production conditions by deliberately testing failure scenarios. Turn off vLLM in staging and verify traffic routes to OpenAI correctly. Check that the circuit breaker opens appropriately. Test that recovery works when vLLM comes back online.
Achieve 80% or higher test coverage to catch regression bugs early. Lower coverage means untested code paths that might contain bugs. Higher coverage gives you confidence that your tests actually validate the code. Focus coverage on critical paths first, then expand to edge cases.
Run load tests at expected production scale to find performance bottlenecks before real users hit them. For example, simulate 7 requests per second (your expected production load) against your staging environment. Monitor response times, error rates, and resource utilization. Fix any problems you discover before launching.
Operations need documentation for when things inevitably break. Write a runbook covering common issues and their solutions. The runbook should include symptoms, diagnostic steps, and remediation steps for each issue. Update the runbook after every incident with lessons learned.
Eventually you might add features that provide extra value but aren’t critical for launch. Multi-region deployment improves latency for global users and provides geographic redundancy. Deploying in US East, US West, and Europe regions means users in each geography get fast response times.
Distributed tracing helps debug complex issues that span multiple services. Tracing shows how a single request flows through your system, identifying where time is spent and where errors occur. This becomes invaluable as your system grows more complex.
Don’t try to implement everything on day one. That leads to scope creep, burnout, and delays to launch. Focus on the essentials first. Add sophistication as you learn what your system actually needs in production. Real usage patterns reveal requirements better than upfront speculation.
Creating Effective Runbooks
A runbook documents how to operate your system when things break. It’s like a detailed instruction manual for fixing problems.

Start with quick links to essential resources at the top of the runbook. Include the Grafana dashboard URL so you can immediately see what metrics look wrong. Include the log aggregation interface (Kibana, CloudWatch, or whatever you use) so you can search for error messages. Include the on-call schedule so you know who to contact for help.
Document common issues with clear symptoms, diagnostic steps, and remediation steps. Each issue should follow a standard template that makes information easy to find under pressure.
Example 1: vLLM Outages
For complete vLLM outages, the symptoms include 100% error rate on the monitoring dashboard, all API requests failing with timeout errors, and constant alert notifications flooding your phone. The diagnostic process involves checking the vLLM health endpoint at /health to see if it responds. Run nvidia-smi on the GPU host to verify GPU availability and look for GPU errors. Check that the vLLM container is actually running with docker ps or kubectl get pods. Look at vLLM logs for error messages that explain what went wrong.
The remediation steps start with restarting vLLM using your container orchestration tool. For Docker Compose, run docker-compose restart vllm. For Kubernetes, run kubectl rollout restart deployment/vllm. Verify GPUs are available and accessible after restart. Check that the circuit breaker routes traffic to OpenAI while vLLM is down so users aren’t completely blocked. If the OpenAI fallback also fails, escalate to senior engineers or management because you have a bigger problem than just vLLM.
Example 2: Slow Performance
For slow performance where the system is working but users complain about speed, symptoms include p99 latency exceeding 3 seconds on dashboards, user complaints in support channels, and requests timing out occasionally. Diagnose by checking GPU utilization with nvidia-smi. If GPU utilization is constantly at 100%, you don’t have enough GPU capacity. Examine queue depth in metrics to see how many requests are waiting. If queue depth keeps growing, requests are arriving faster than you can process them. Look for memory leaks where memory usage creeps up over time on host metrics.
Fix high GPU utilization by scaling horizontally with additional instances. For Kubernetes, run kubectl scale deployment/vllm --replicas=5 to add more capacity. For AWS ECS, update the service’s desired count. Address large queue depths the same way because more instances provide more processing capacity. If you suspect a memory leak (memory usage growing steadily without returning), restart vLLM to clear memory temporarily, then file a bug report and monitor for recurrence.
Example 3: OOM Errors
Out of memory errors cause vLLM to crash with “CUDA out of memory” messages in logs. This usually happens when requests are too large for available GPU memory. The immediate fix involves lowering the max-model-len configuration parameter in your vLLM startup script. Reduce gpu-memory-utilization to leave more buffer for large requests. Restart vLLM to apply configuration changes. If problems persist, consider upgrading to a larger GPU instance type like AWS p4d instances that offer more memory.
Example 4: Unreliable Service
High OpenAI costs indicate your fallback is being used too frequently, which means vLLM is unreliable. Check the fallback rate metric. Investigate why vLLM is unstable by looking at instance health, error logs, and recent deployments. Examine the circuit breaker state to see if it opened due to detected problems. Fix the underlying vLLM issues causing the high fallback rate. Reset the circuit breaker if needed after fixing the root cause.
Looking Forward: Next Steps
After implementing everything in this series, you have a complete production system. You’ve built type-safe LLM applications using BAML. The test coverage from Part 3 catches regression bugs before they reach users. The self-hosted vLLM infrastructure from Part 4 reduces costs when the economics make sense. Monitoring and alerts tell you what’s happening. CI/CD pipelines deploy consistently without manual steps. Runbooks guide your team through incidents. You can deploy confidently because the infrastructure and processes support production traffic reliably.
At 5 million requests per month, the economics clearly favor self-hosting. Using OpenAI API exclusively costs $13,750 per month or $165,000 annually. Self-hosting costs $727 per month for infrastructure ($8,724 annually) plus roughly $4,000-5,000 monthly in engineering time for maintenance and incidents. Net savings remain around $150,000 per year even after accounting for engineering overhead.
However, self-hosting doesn’t make sense at all volumes. Below 200,000 requests monthly, just use the API. The engineering overhead isn’t justified by the cost savings. Between 200,000 and 500,000 requests, the API is probably still the right choice depending on your team’s capabilities and available engineering time. Above 500,000 requests monthly, self-hosting starts making financial sense. Above 5 million requests, self-hosting is definitely worth the operational complexity!
As your system grows, you’ll need more advanced infrastructure. Deploy vLLM in multiple AWS regions (US East, US West, Europe) and route users to the closest one. This cuts latency for global users but requires more complex traffic routing and data synchronization.
Kubernetes handles more complex orchestration than Docker Compose. You get horizontal pod autoscalers, native rolling updates, and granular resource management. The tradeoff is operational complexity. Learning and maintaining Kubernetes takes time, but it’s worth it once your system reaches a certain scale.
Model fine-tuning becomes relevant when open source models aren’t quite good enough for your specific use case. Fine-tuning requires ML expertise to design training approaches, GPU time for training runs, and data preparation infrastructure. However, fine-tuned models can dramatically improve quality for domain-specific applications. The investment pays off when model quality directly impacts user satisfaction or business metrics.
The LLM space moves fast. New models drop frequently. vLLM releases updates every few weeks. Stay current by following the vLLM GitHub for releases, checking HuggingFace for new models, and joining communities like r/LocalLLaMA where people share what actually works in production.
Upgrade thoughtfully. Test new vLLM versions in staging every 2-3 months before rolling them to production. Try new models when the quality improvement justifies the migration risk. Upgrade infrastructure when the benefits clearly outweigh the cost and complexity of migration
Conclusion
This series covered everything you need to run LLMs in production. Type-safe code with BAML. Tests that catch bugs before users do. Monitoring that tells you what’s happening. CI/CD that deploys consistently. Deployment strategies that limit risk.
Building production systems is hard work. It requires infrastructure knowledge, software skills, and operational discipline. But there’s real satisfaction in building something that works reliably at scale.
Happy building 🔨